
India Is the World’s Largest Product

A Product Manager’s Guide to GDP, North Star Metrics, and the Village-to-GDP Journey
Imagine for a moment that India is not a country.
Imagine India is a product. The largest product ever built.
It has more than 1.46 billion users. Around 800 districts. Over 2.5 lakh gram panchayats. More than 6.4 lakh villages. Millions of businesses transacting every single day.
Now imagine you are the Chief Product Officer responsible for all of it.
One day your Board asks a simple question:
“How is India doing?”
You cannot show them 10,000 metrics. You need one number. One North Star.
The answer most economists, governments, investors, and media reach for is: GDP.
Just like Spotify uses Listening Minutes. Just like Uber uses Completed Trips. Just like Airbnb uses Nights Booked — India uses GDP as its headline North Star.
And that is where the story gets interesting. Because every great product manager eventually learns a painful lesson: a North Star is not reality. It is only a compressed representation of reality. And sometimes, that compression hides the most important truths.
What Exactly Is GDP?
Most people talk about GDP without fully understanding what it measures. Let us fix that.
GDP — Gross Domestic Product — is the total monetary value of all final goods and services produced within a country’s borders over a year. Economists calculate it with one formula:
| GDP = Consumption (C) + Investment (I) + Government Spending (G) + Net Exports (X − M) |
In plain language: GDP adds up everything India consumes, every factory and home being built, every rupee the government spends, and every good we export minus what we import.
| India’s GDP — The Numbers (FY 2024–25) Real GDP (inflation-adjusted): ₹187.97 lakh crore | Growth: 6.5% Nominal GDP (current prices): ₹330.68 lakh crore | ~$3.6–3.7 trillion USD Private Consumption share: ~57.5% of GDP (the single largest driver) Services share of output: ~55% of GVA (but employs only ~30% of workforce) Agriculture share of output: ~18% of GVA (but employs ~44% of workforce) |
That last pair of lines contains a fact every product manager should pause on. Agriculture employs nearly half of India’s workforce but generates less than a fifth of economic output. Services generate more than half of output but employ less than a third of workers. That productivity gap — invisible inside the GDP headline — is the defining challenge of India’s development.
From a product analytics lens, GDP does what Listening Minutes does at Spotify: it compresses a huge range of behaviours into one number that leadership can align around. It is not reality itself. It is a summary statistic. Powerful, useful — and always incomplete.
The Product Analytics Ladder
My journey in product management led me to develop a framework that significantly changed my perspective on data. It started with one observation that sounds obvious but is almost universally ignored:
| People confuse metrics with reality. A metric is not reality — it is an attempt to represent reality. |
The journey from reality to a business outcome has seven steps, and organisations that skip steps make catastrophically bad decisions:
| Level | What it means in a product | What it means for India |
| Reality | What users actually need in their lives | How citizens actually live and work |
| Behaviour | How they interact with your product | Whether they work, invest, save, build |
| Measurement | The events and KPIs you track (DAU, etc.) | GDP, employment rates, productivity data |
| Analytics | What you compute from those measurements | Growth rates, sector comparisons, forecasts |
| Understanding | The story you build from the analysis | Economic diagnosis and policy narratives |
| Decision | The bets and experiments you place | Fiscal policy, monetary policy, reforms |
| Outcome | What actually changes for the user | Real prosperity, jobs, quality of life |
GDP lives at Layer 3 — Measurement. It is a number derived from behaviour, compressed into a dashboard. The danger is when leaders treat Layer 3 as if it were Layer 7. When the metric becomes the mission.
Great product managers obsess about all seven layers simultaneously. They never let a clean dashboard number convince them that the underlying reality is equally clean.
Behaviour Always Tells the Truth
One of the most important lessons I’ve learned is about the intention–behavior gap..
A customer may say: “I love this app” — and never open it again. A user may say: “I would definitely use this feature” — and never touch it. An Ola rider may give you a 5-star rating — and switch to a competitor the next day.
| Behaviour reveals reality. Opinions often reveal aspirations. |
This is why the best product managers trust what people do over what people say. And the same principle applies to entire economies.
Governments announce policies. Economists publish forecasts. Media builds narratives. But what ultimately moves GDP is behaviour: whether people are working, whether businesses are investing, whether factories are producing, whether citizens are becoming more productive.
For India, the most revealing behavioural metric over the last decade is labour force participation — who is actually showing up to work:
| Metric | 2017–18 | 2022–23 | What it signals |
| Overall Labour Force Participation Rate | ~75.8% | ~78.5% | More people entering the workforce |
| Female Labour Force Participation (PLFS) | ~23.3% | ~37% | Meaningful shift in women’s economic activity |
| Youth Unemployment (independent surveys) | High | ~45% | Growth is not yet creating enough quality jobs |
| Informal workforce share | ~88% | ~90% | Most workers still outside formal protections |
This is the tension inside India’s growth story. Labour force participation is rising — which is genuinely positive. But the quality of those jobs, particularly for young people and the informal workforce, tells a more complicated story. High GDP growth coexisting with high youth unemployment is a signal that the product’s top-line metric is healthy, but user engagement at the ground level has a serious problem.
Is GDP a Good North Star? Let’s Run the Test.
In product analytics, a good North Star metric must satisfy four conditions. Let us evaluate GDP honestly against each one:
1. Does it reflect user value?
If the metric rises, should users be genuinely better off? GDP mostly passes this test. Countries with higher GDP per capita tend to have better infrastructure, better healthcare, higher incomes, and longer lives. The correlation is real — but it is not perfect. GDP does not measure whether growth reaches everyone, or just the top.
2. Does it predict long-term success?
A good North Star should predict future health, not just present activity. GDP partially passes. Sustained GDP growth creates stronger tax revenues, better investment conditions, and more resilient institutions. But GDP alone cannot tell you whether those jobs being created are good jobs, whether productivity is actually improving, or whether growth is sustainable over decades.
3. Can teams influence it?
Governments can directly move GDP through infrastructure investment, education policy, trade agreements, tax reforms, and monetary policy. GDP passes this test. Teams — whether in Delhi or in a district collector’s office — can take concrete actions that move the number.
4. Does it resist gaming?
This is where GDP begins to struggle. Every product manager should commit Goodhart’s Law to memory:
| When a measure becomes a target, it ceases to be a good measure.— Charles Goodhart, economist |
The moment organisations start optimising for the number rather than the outcome it represents, the number becomes unreliable. This happens in products. It also happens in countries.
Think of the Ola driver who asks for a 5-star rating before you leave the car. The rating goes up. The ride quality does not. The metric improved. The reality did not.
The same pattern appears at national scale:
| The target metric | What gets measured | What actually happens |
| School enrolment | Students enrolled | ASER surveys show Grade 5 students unable to read Grade 2 text |
| Investment announcements | Crores announced | Project implementation lags by years; job creation below targets |
| GDP growth | Aggregate output rises | Employment quality stagnates; informality increases; bottom 50% see limited gains |
| Ola 5-star ratings | Ratings improve | Rider books a competitor next time |
None of these metrics are wrong or useless. They are all valuable signals. But every one of them can be gamed, and every one of them can rise while the underlying reality deteriorates. This is why no serious organisation runs on a single metric — and why India should not either.
GDP Is Not Created in Delhi
Here is one of the biggest misconceptions about India’s economy: people think GDP is something governments produce. It is not.
| GDP is created in villages. It is a citizen-generated metric, not a government metric. |
To understand how GDP actually gets created, follow a single grain of wheat.
| A Farmer’s Journey Becomes India’s GDPA farmer in a Punjab village grows wheat.She uses electricity from the grid, water from an irrigation canal, seeds bought on credit.She sells the harvest to a trader at the local mandi.A truck carries it to a warehouse — adding logistics value.A flour mill processes it into atta — adding manufacturing value.A retailer sells a packet to a family — adding distribution value.A family cooks a meal — the final act of consumption. Every single step creates value. Every step contributes to GDP.Now multiply this by millions of farmers, millions of shopkeepers,millions of truck drivers, millions of factories, millions of startups.GDP is the sum of all these micro-behaviours. |
The aggregation chain looks like this:
Individual → Family → Village → Panchayat → Block → District → State → India → GDP
India has more than 6.4 lakh villages, each one a node of economic behaviour. Homes, farms, shops, micro-enterprises. Every transaction, every crop, every service — they all flow upward and become the GDP number that appears on Bloomberg.
This means that decisions made in Delhi about infrastructure, education, and credit access matter — but only if they reach the village. The strategy is only as good as its last-mile execution.
Building India’s GDP Metrics Tree
Great product teams do not manage to a single number. They build a metrics tree — a structured breakdown of what drives the North Star, and what drives those drivers. Here is India’s GDP metrics tree:
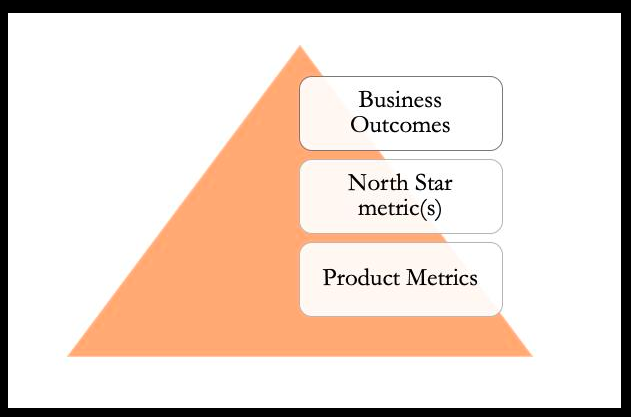
Layer 1: The North Star
GDP and GDP per capita. This is what investors track, what media reports, and what governments celebrate. But GDP is only the outcome — just like revenue is the outcome of a product, not the cause of it.
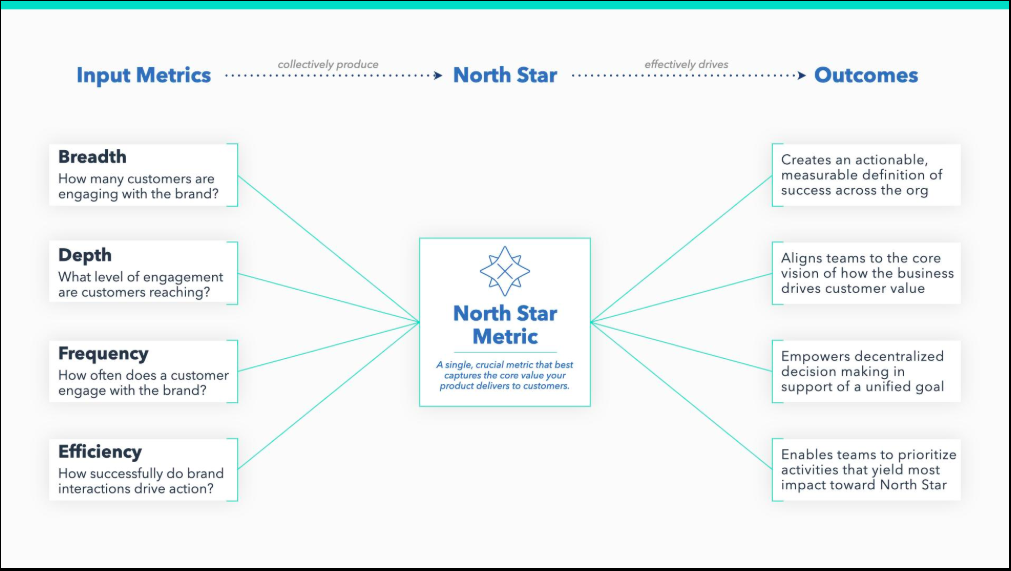
Layer 2: The Six Input Metrics
GDP is driven by six major inputs. Move any one of these, and GDP moves. Ignore any one of them, and the North Star eventually weakens.
| Input | What it measures | India’s current status |
| Productivity | Output per worker per hour | Low vs global peers; improving but from a low base |
| Employment & Labour Force | Who is working and in what quality of work | LFPR rising; but informality at ~90%, youth unemployment high |
| Capital Formation | Investment in machines, buildings, infrastructure | Government capex at record highs; private investment recovering |
| Human Capital | Health, education, skills of the workforce | Improving; but learning outcomes lag enrolment numbers |
| Infrastructure | Roads, power, internet, ports, logistics | Significant gap closed; last-mile connectivity the remaining challenge |
| Innovation | New ideas, patents, startups, R&D | Startup ecosystem thriving; R&D at 0.7% of GDP vs China’s 2.4% |
Layer 3: The Driver Metrics
These are the metrics that district administrators, gram panchayats, and local teams can actually move. This is where policy becomes action:
| Productivity drivers | Employment drivers | Human capital drivers | Innovation drivers |
| Electricity availability | MSME creation rate | School enrolment & attendance | Patents filed per year |
| Road quality index | Female workforce entry | Student learning outcomes (ASER) | R&D spend as % of GDP |
| Internet penetration | Startup formation | Nutrition & child health | Startup funding rounds |
| Digital payments adoption | Skill training completion | Teachers trained & present | University research quality |
| Logistics efficiency | Factory employment | Technical training institutes | Deep-tech investments |
The tree matters because it tells every level of government and every team exactly which lever they can pull. A district collector cannot directly move GDP. But she can ensure that the local road is repaired, that the school has a functioning teacher, that MSMEs have access to formal credit. Move enough of those drivers, and GDP follows.
India’s Administrative Hierarchy as a Metrics Cascade
India’s governance structure can be understood as a cascading metrics system — each layer aggregating the performance of the one below it, exactly the way product teams roll up event data into dashboards.
| Level | Scale | Primary economic role |
| Villages & wards | 6.4 lakh+ | Where behaviour originates: production, consumption, labour |
| Gram panchayats | ~2,55,000 | Local governance: roads, water, schools, MGNREGA |
| Blocks & tehsils | ~6,000+ | Sub-district coordination and welfare delivery |
| Districts | ~800 | Operational governance: capex execution, law & order, land |
| States & UTs | 28 + 8 | Policy, spending priorities, fiscal management |
| India (Union) | 1 country | The North Star: GDP, monetary policy, external affairs |
Each gram panchayat is effectively a local product pod with its own execution targets: roads built, drinking water provided, MGNREGA days delivered, school days operational. When these small pods perform well, the district metrics improve. When districts improve, state GDP rises. When enough states rise, India’s North Star moves.
The insight for product managers: India is not one product. It is 2,55,000 products — each a gram panchayat — running on one shared platform. The platform provides the rules, the budget, and the infrastructure. The pod provides the execution.
Where Metrics and Reality Start to Diverge
Here is something no one puts in a press release: every major economy has gaps between what metrics say and what reality is. India is no different — and understanding those gaps is exactly what separates a naive reading of GDP from a sophisticated one.
The Employment Paradox
India’s official unemployment rate for 2023–24 is reported at around 3.2% (PLFS). Independent household surveys place it at 8–9%. Youth unemployment in independent surveys has been measured as high as 45%.
How can both be true? Because different surveys use different definitions. Official figures count anyone working even one hour a week as employed. Independent surveys measure broader economic participation. Neither is wrong — but treating either as the complete picture is.
For a product manager, this is equivalent to counting a user as “active” if they merely opened the app once in 30 days. Technically accurate. Operationally misleading.
The Inequality Signal
GDP growth in aggregate does not tell you who captures that growth. India’s top 10% of earners take home approximately 57% of national income. The bottom 50% share about 15%. GDP can grow strongly while median household consumption grows slowly — and this is exactly what has been documented over the past decade.
In product terms: your DAU is growing, but 55% of your users report low satisfaction and limited feature engagement. The top-line metric looks great. The retention problem is growing underneath it.
The Execution Gap
India has world-class policy design. The gap between announced policy and delivered outcomes is where the real management challenge lives.
| Policy / Programme | What it promises | What execution data shows |
| MGNREGA | 100 days of guaranteed work per rural household | ~46 days delivered on average in recent years |
| Schools | Universal quality education (RTE Act) | ASER 2023: many Grade 5 students cannot read Grade 2 text |
| Rural roads (PMGSY) | All-weather connectivity for every village | ~40% of rural roads need re-repair within 5 years of construction |
| Startups (DPIIT) | Innovation-led job creation | 100,000+ registered startups; ~5,000 have raised institutional capital |
None of this diminishes the genuine progress India has made. It simply makes the point that a product which reports 100-day delivery but consistently delivers 46 days has a product quality problem that will not be solved by improving the reporting.
The Dashboard India Actually Needs
If India were a great product company, GDP would be the headline metric — never the only metric. Here is what a complete country dashboard should look like:
Engagement Metrics — Are Users Getting Value?
- Labour Force Participation Rate (are people working?)
- Quality employment rate — formal, EPFO-registered jobs (are they good jobs?)
- Median household consumption growth — is the middle growing?
- Consumption decile growth — is the bottom 50% keeping pace with the top?
Product Health Metrics — Is the System Improving?
- Productivity growth per worker (are we getting more efficient?)
- Manufacturing GVA share (are we industrialising at the right pace?)
- Credit access for MSMEs and informal sector (can people build?)
- Export market share in high-value goods and services (are we moving up the value chain?)
Strategic / Future-Readiness Metrics — Are We Building for Tomorrow?
- R&D spend as % of GDP (India: ~0.7% vs China: 2.4%, US: 3.5%)
- Education quality outcomes — ASER learning levels, not just enrolment
- Energy independence and renewable capacity (cost and carbon resilience)
- Startup jobs created, not just startups registered
Execution Quality Metrics — Is Strategy Reaching the Ground?
- MGNREGA actual delivery vs 100-day entitlement
- District capex utilisation rate (how much of sanctioned funds is actually spent?)
- DBT beneficiary reach rate (are transfers reaching intended recipients?)
- Rural infrastructure durability index (are assets we build lasting?)
| This is what a senior product leader does: they never show the board just one number. They show a story — where are we strong, where are we at risk, and what needs fixing. GDP is the headline. The dashboard is the truth. |
The Final Lesson
The purpose of this analysis is not to find a number.
The purpose is to ensure that the number you track remains honestly connected to the reality you are trying to improve.
Spotify’s Listening Minutes are not music. Uber’s Completed Trips are not mobility. Ola’s ratings are not ride quality. And India’s GDP is not prosperity.
They are all representations — powerful, useful, necessary representations. But representations nonetheless. The moment a leader stops looking beneath the number, they stop understanding the system they are responsible for.
India’s GDP will continue to grow. The country has structural tailwinds — a young population, a growing services sector, a maturing startup ecosystem, and significant room to improve productivity in agriculture and manufacturing. These are real and they are important.
But the question that matters is not: Is the North Star rising?
The question that matters is: are the drivers underneath it — jobs, skills, inclusion, execution — compounding in the right direction?
For every product manager reading this: you already know how to think about this. You do it every time you refuse to celebrate a DAU spike before understanding where it came from. You do it every time you ask whether retention is holding. You do it every time you look beyond the dashboard and ask: are our users actually better off?
India needs that same mindset applied at national scale. Not cynicism about the numbers. Not dismissal of the progress. Just the honest, rigorous discipline to look at the full metrics tree — from the North Star all the way down to the village — and ask whether the whole system is moving in the right direction.
GDP is the North Star.
Prosperity is the mission.
And confusing the two is where both products and nations get into trouble.
Quick Reference — Key Numbers
- India Population (2025 est.): ~1.46 billion
- States & Union Territories: 28 + 8 = 36 units
- Districts: ~800 | Gram Panchayats: ~2,55,000 | Villages: ~6,40,000+
- Nominal GDP FY 2024–25 (Provisional): ₹330.68 lakh crore (~$3.6–3.7 trillion USD)
- Real GDP FY 2024–25: ₹187.97 lakh crore | Growth rate: 6.5%
- Private Consumption: ~57.5% of GDP | Services: ~55% of GVA
- Agriculture: ~18% of GVA but ~44% of employment — this gap is the story
- Female LFPR (PLFS 2022–23): ~37% | Overall LFPR: ~78.5%
- India R&D spend: ~0.7% of GDP (China: 2.4% | USA: 3.5%)
- Top 10% income share: ~57% | Bottom 50% income share: ~15%
AI Product Thinking:
https://aiproductthinking.com/contact/
Please connect with me on LinkedIn:
https://www.linkedin.com/in/iimk-manishmishra/